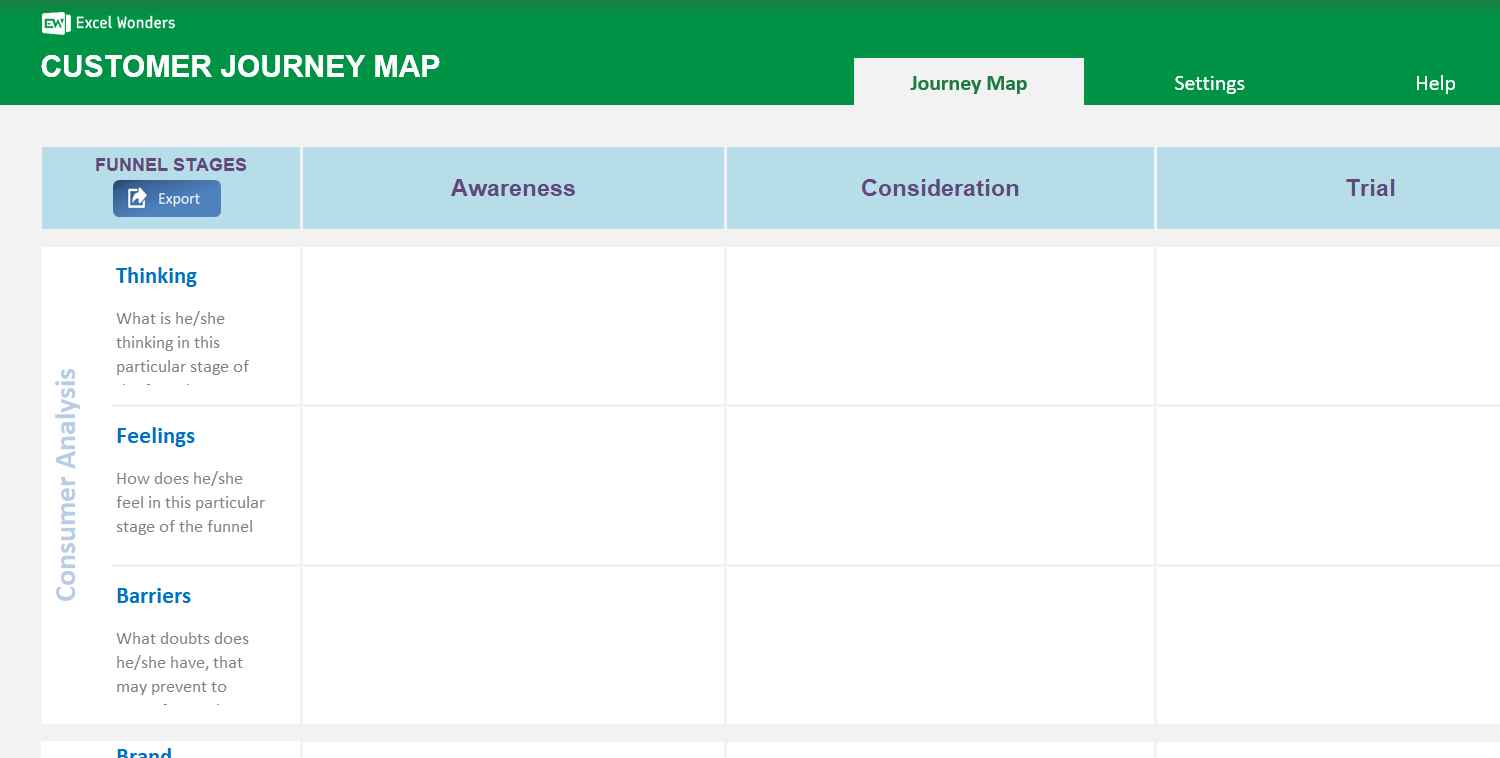
The Customer Journey Map Excel Template enables you to visually map out the entire consumer journey, and with that understand consumer sentiment, how your brand communicate at various stages of the journey, the specific tactics to implement, and KPIs.
The Customer Journey Map Excel Template enables you to visually map out the entire consumer journey, and with that understand consumer sentiment, how your brand communicate at various stages of the journey, the specific tactics to implement, and KPIs.
Our Customer Journey Map Excel Template is the ultimate tool for visualizing every touchpoint, helping you identify gaps and opportunities in your brand’s engagement strategy.
Easily customize stages, labels, and sections to suit your business—whether you’re a seasoned marketer or new to journey mapping. With full control over what’s displayed, you can create a unique, brand-specific view of the consumer journey.
Created by marketing professionals with extensive experience in customer experience design, this Excel template is built for both strategic planning and day-to-day execution, ensuring your journey map drives real business results.
Trusted by marketers worldwide, this template offers simple setup, intuitive controls, and export-ready output so you can share your insights with stakeholders and track meaningful KPIs with confidence.
Features:
2 reviews
2 reviews
Great marketing template! Useful for any marketers!
Review for: Customer Journey Map Excel Template
Super easy to use! Great template!
Review for: Customer Journey Map Excel Template
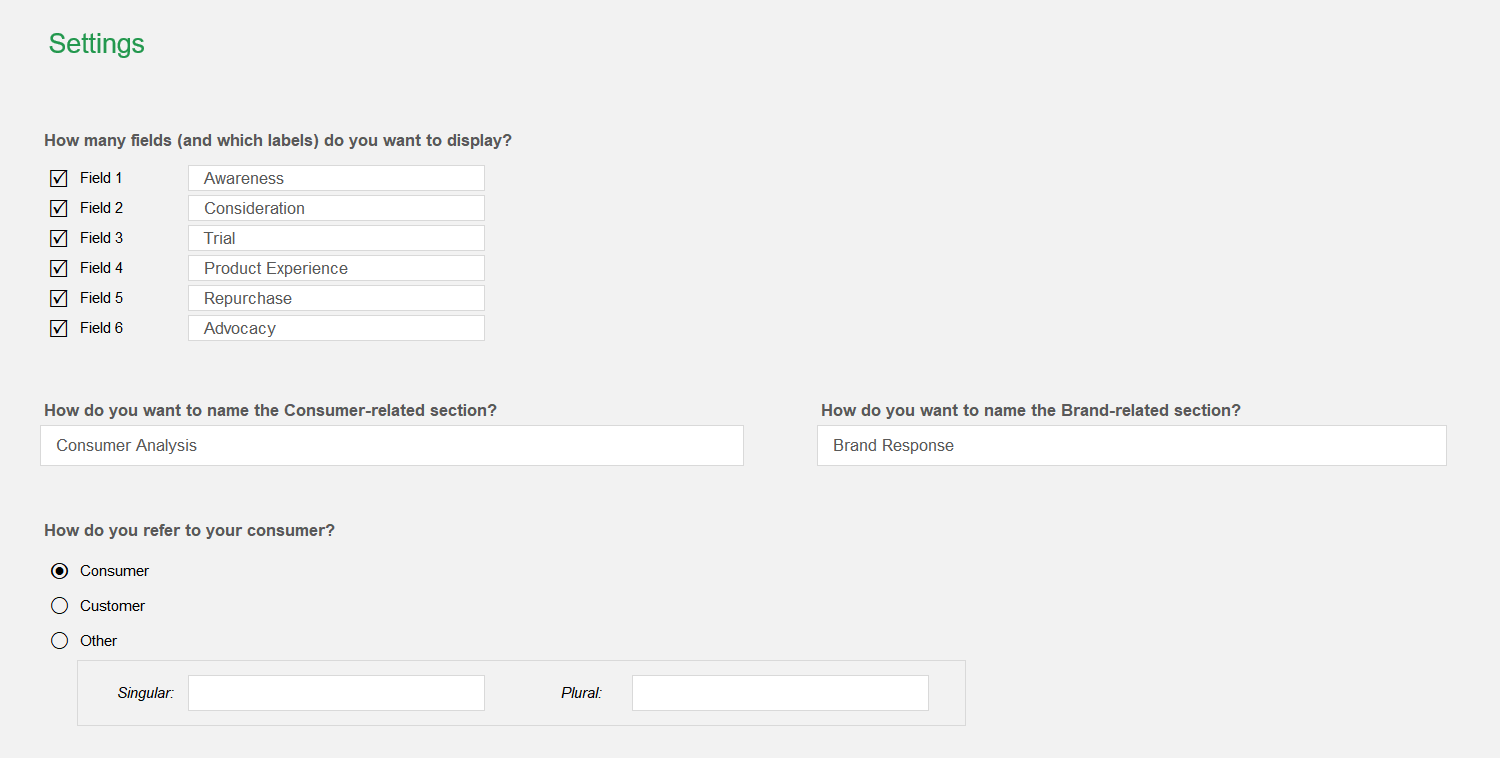
You can customize the stages (columns) of the customer journey map on the 'Settings' sheet. There, you can enable or disable up to six stages and edit their labels.
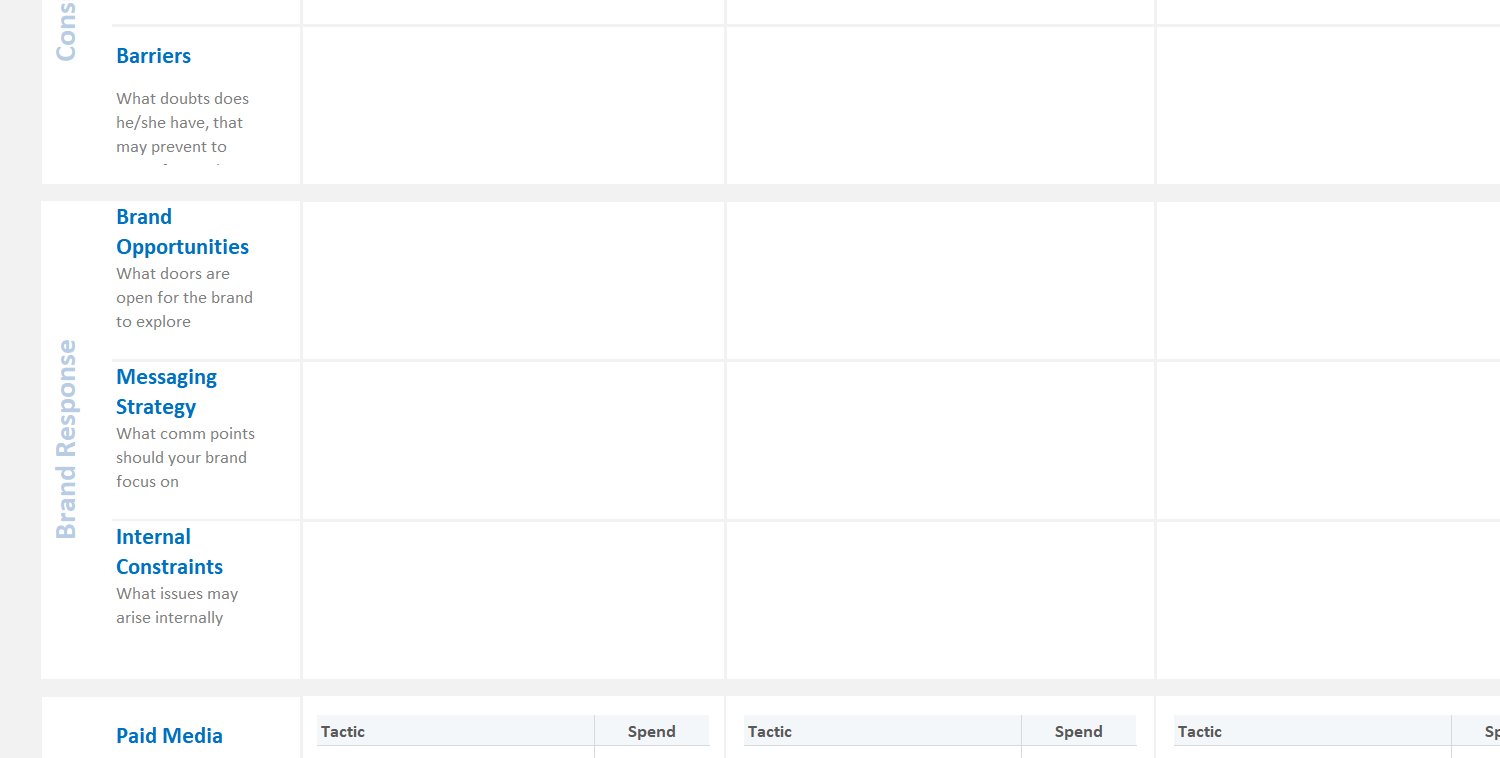
All customization for the map's rows is done on the 'Settings' sheet. You can edit the main titles for the 'Consumer' and 'Brand' sections, edit the labels for each row, and use checkboxes to show or hide specific rows.
Yes. When you enter a large amount of text into a cell, the row height will automatically adjust to ensure all content remains visible.
Directly adding images within the template is not supported. As a workaround, you can first export the map to a new Excel file and then insert your images into that file.
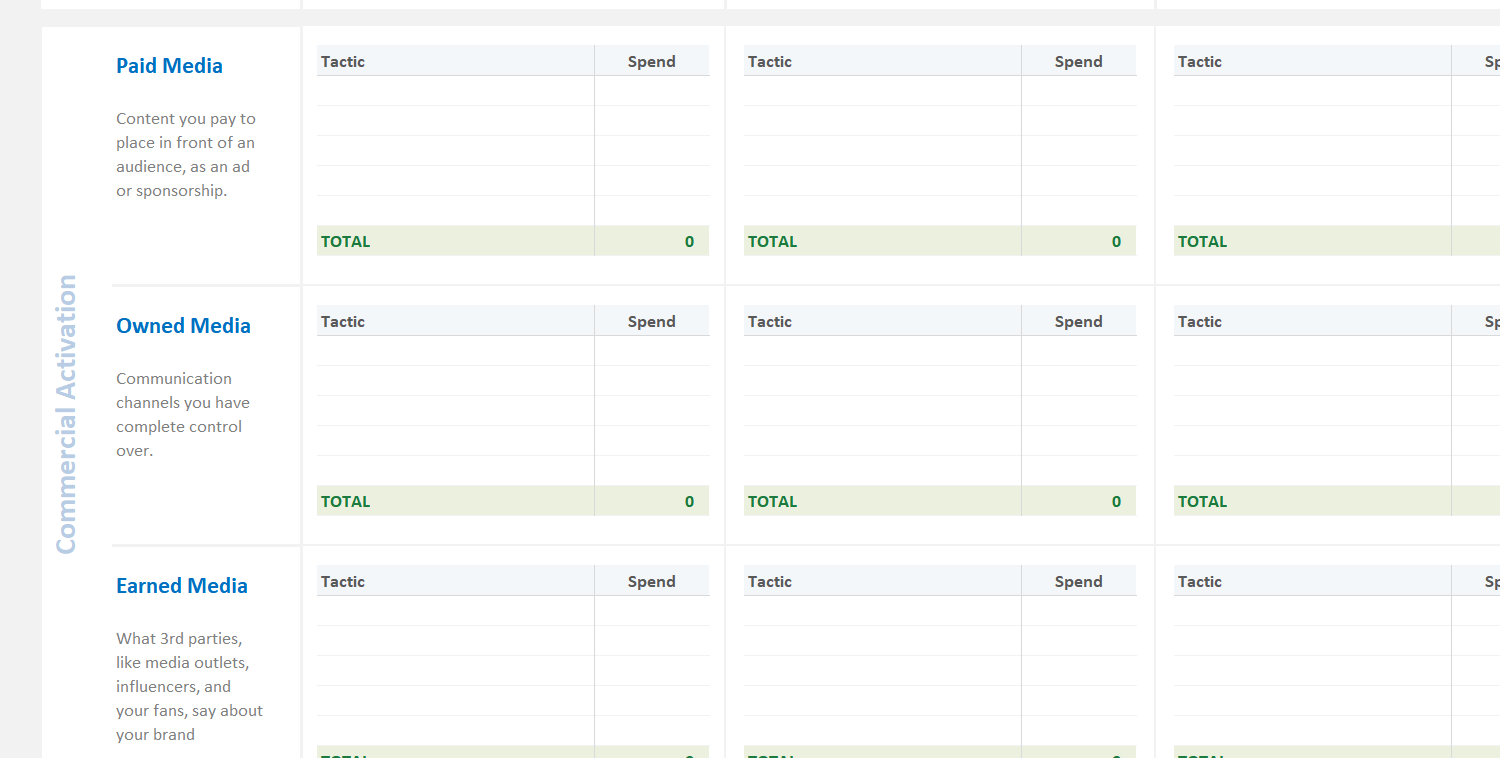
The 'Commercial Activation' section includes tables for Paid, Owned, and Earned media. On the 'Settings' sheet, you can use the dropdown menus to set the number of visible rows (up to 20) for each table.
Yes. You can choose to show or hide the 'Totals' row for these tables by adjusting the option on the 'Settings' sheet.
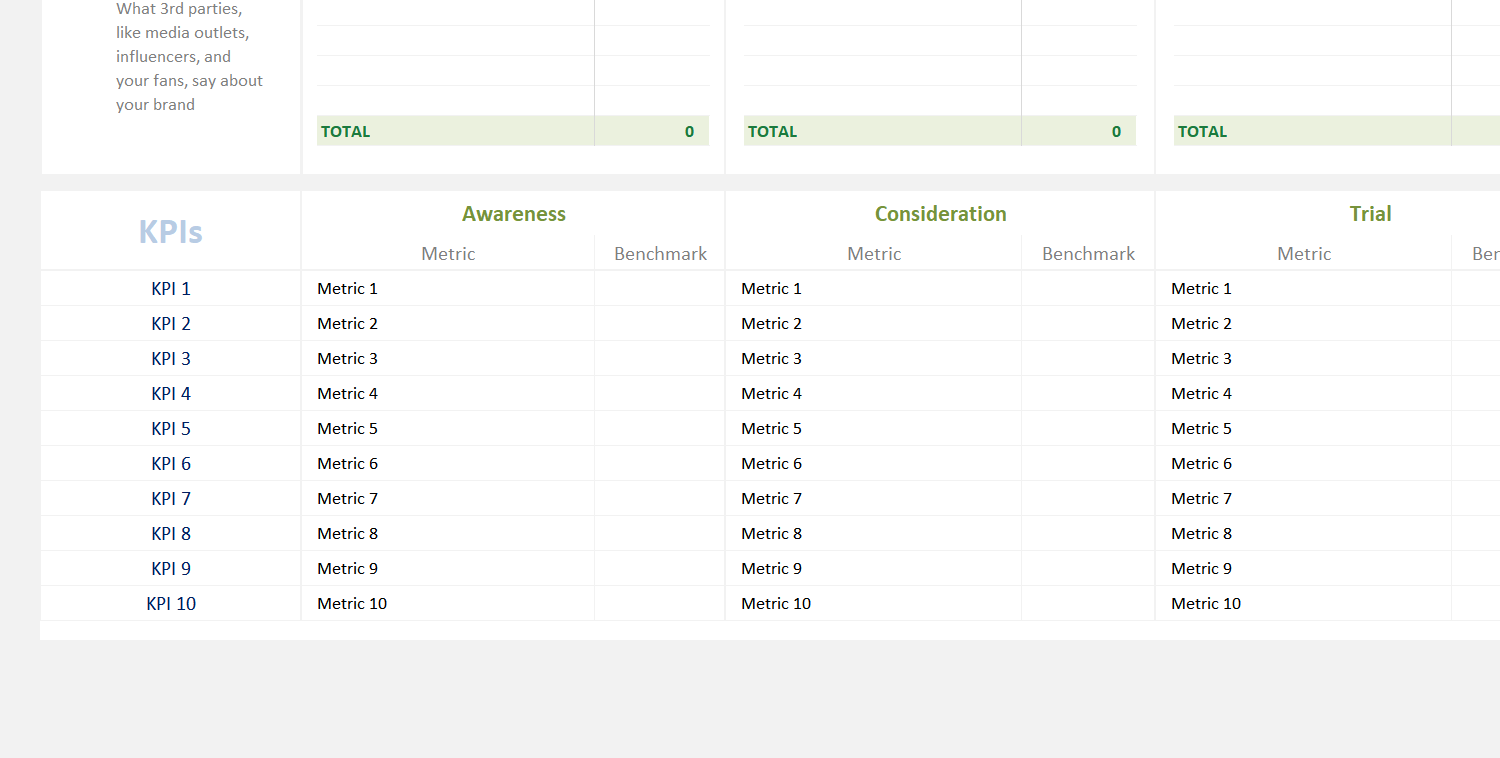
Yes. The visibility of the entire 'KPI' section can be controlled from an option on the 'Settings' sheet.
Yes. Click the 'Export' button in the top-left corner of the map. In the pop-up window, you can select the file name, location, and format (PDF or Excel). Note: Any rows or columns hidden in your map will not be included in the exported file.