The Timeline Excel Template allows anyone to create beautiful timelines, either horizontal or vertical, in a highly intuitive and customizable manner. You can organize your list of events the way you want and navigate through your timeline in a seamless and intuitive way.
The Timeline Excel Template allows anyone to create beautiful timelines, either horizontal or vertical, in a highly intuitive and customizable manner. You can organize your list of events the way you want and navigate through your timeline in a seamless and intuitive way.
Need a clear, professional way to present key dates and milestones? Our Excel Timeline Template is the easiest way to turn scattered data into a visually compelling timeline that’s ready for reports, presentations, or project tracking.
With flexible horizontal and vertical layouts, you can design timelines that fit your purpose—whether you’re mapping a project’s progress, showcasing historical events, or planning future activities.
Backed by years of spreadsheet design expertise, this template has been refined for accuracy, usability, and seamless Excel integration, giving you both visual impact and precise organization.
Trusted by professionals, educators, and students worldwide, Excel Wonders provides secure downloads, tested functionality, and step-by-step guidance so you can build timelines with confidence.
Features:
1 review
1 review
This template is so quick and easy to use. Love the ability to quickly pull together timelines and arrange in different ways to tell a story. I’ve used this in both my professional and personal life to organize and stay on track with milestones. So easy to use and intuitive.
Review for: Timeline Excel Template
Yes. The data table includes three optional columns. On the 'Settings' sheet, you can either hide these columns entirely or keep them visible and edit their labels.
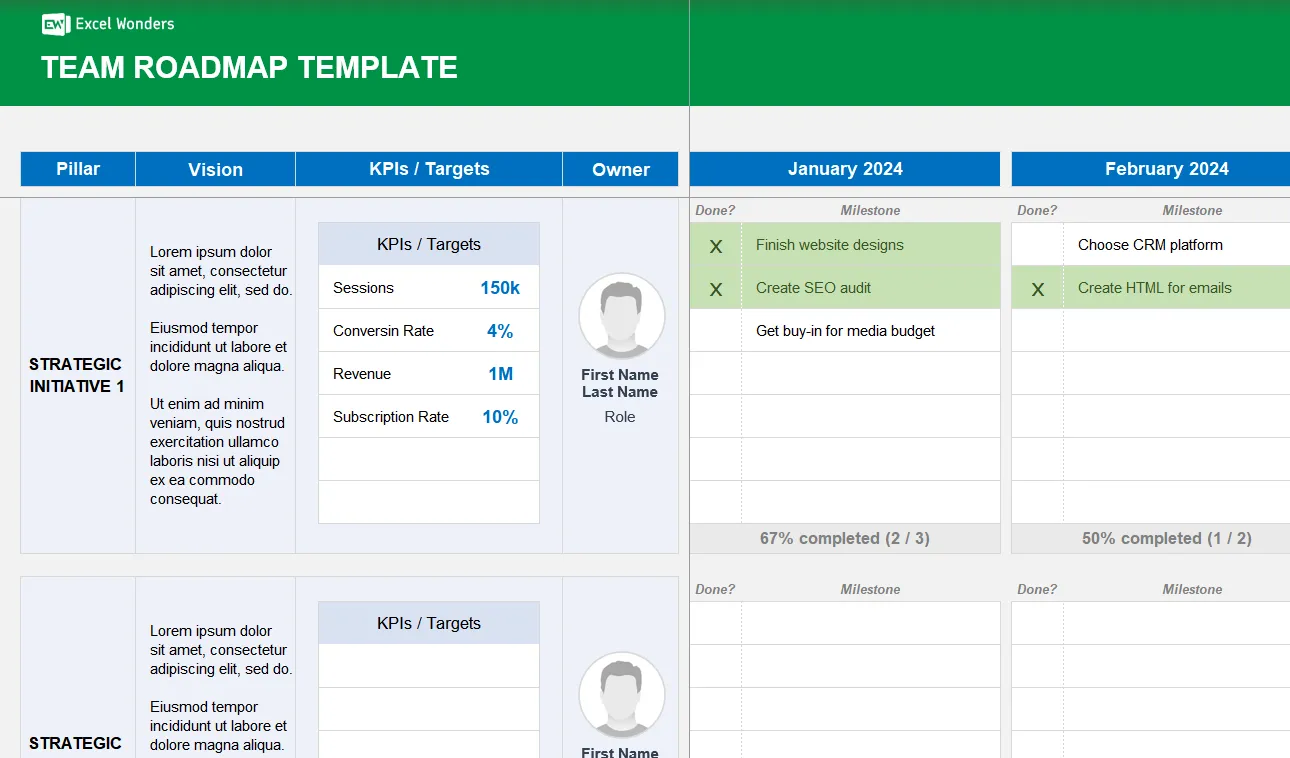
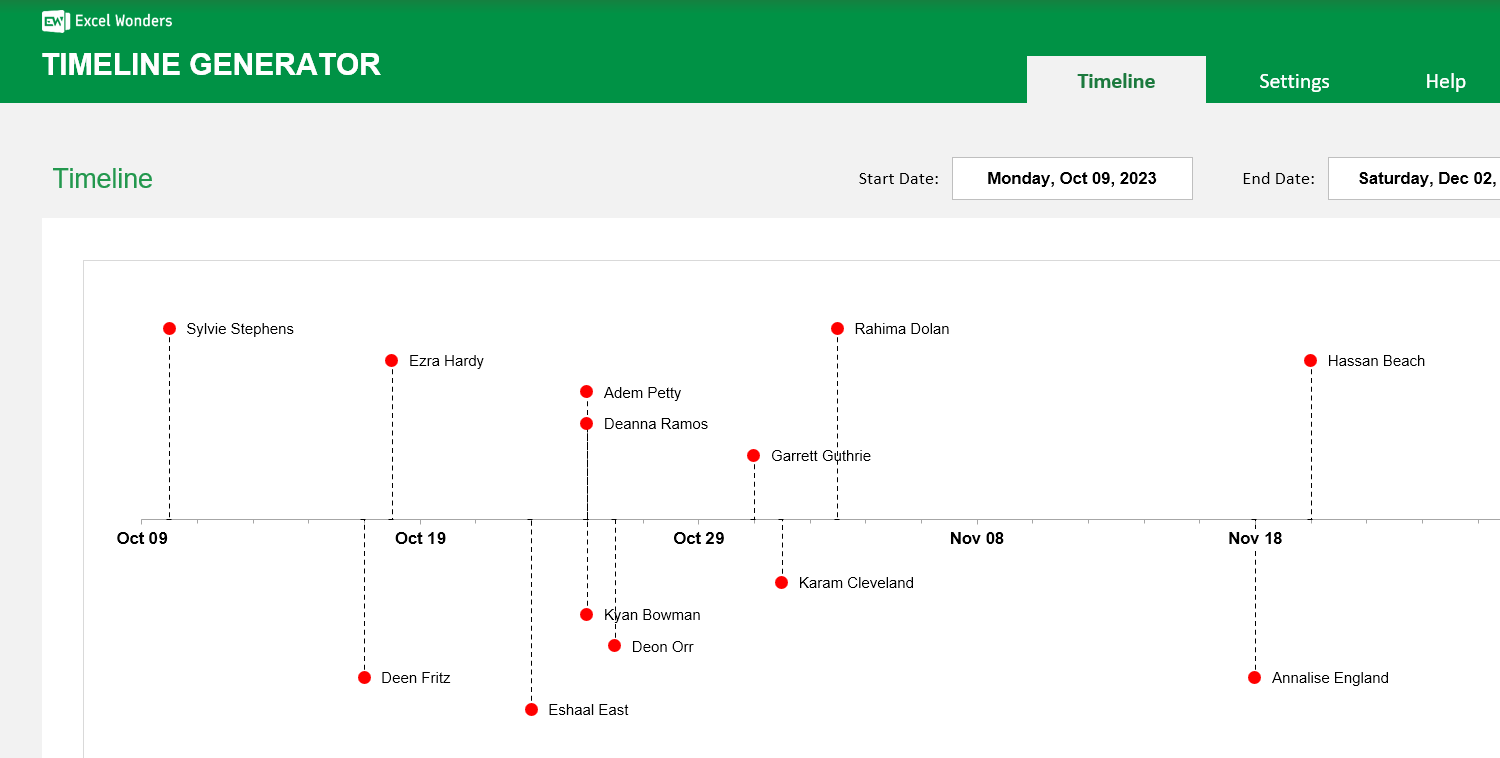
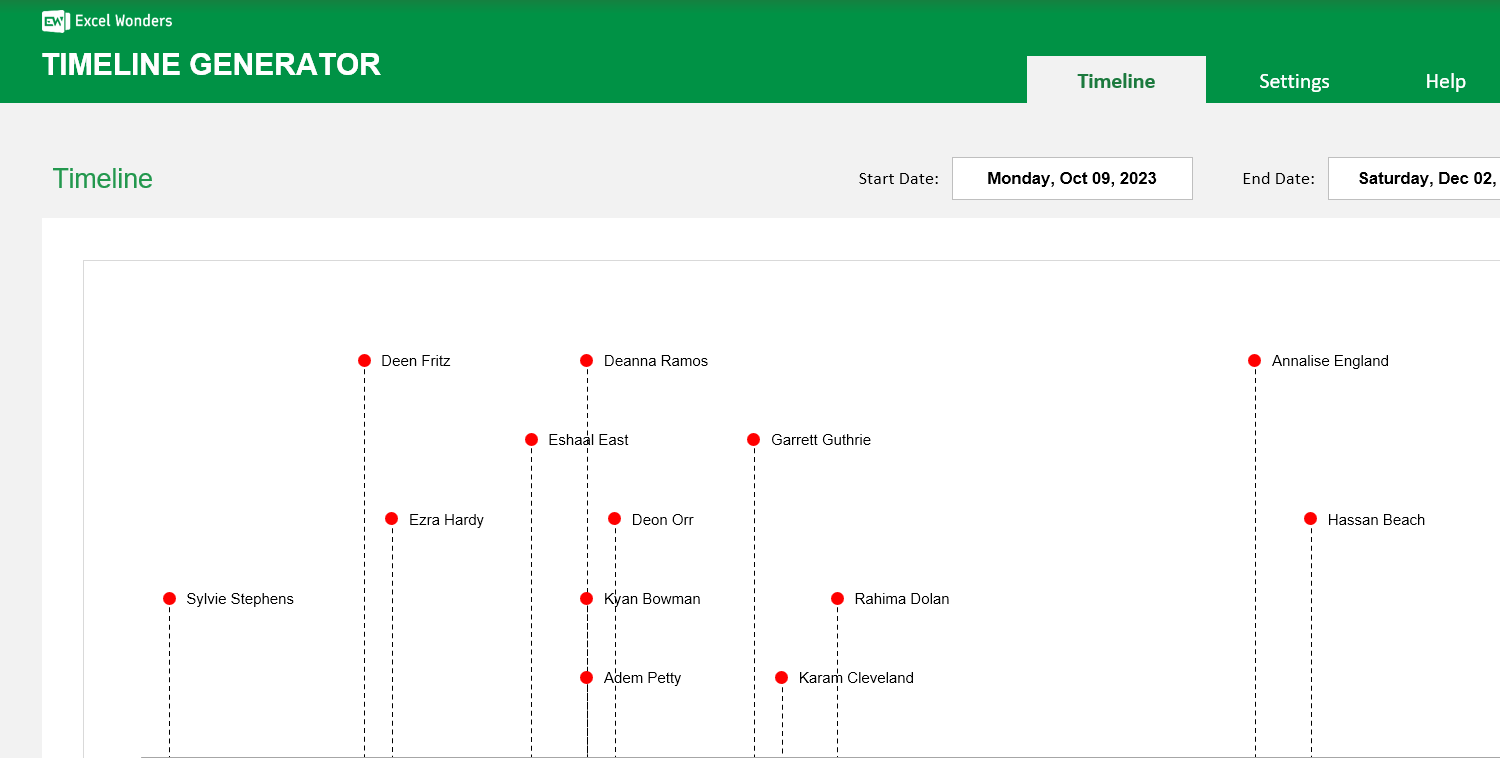
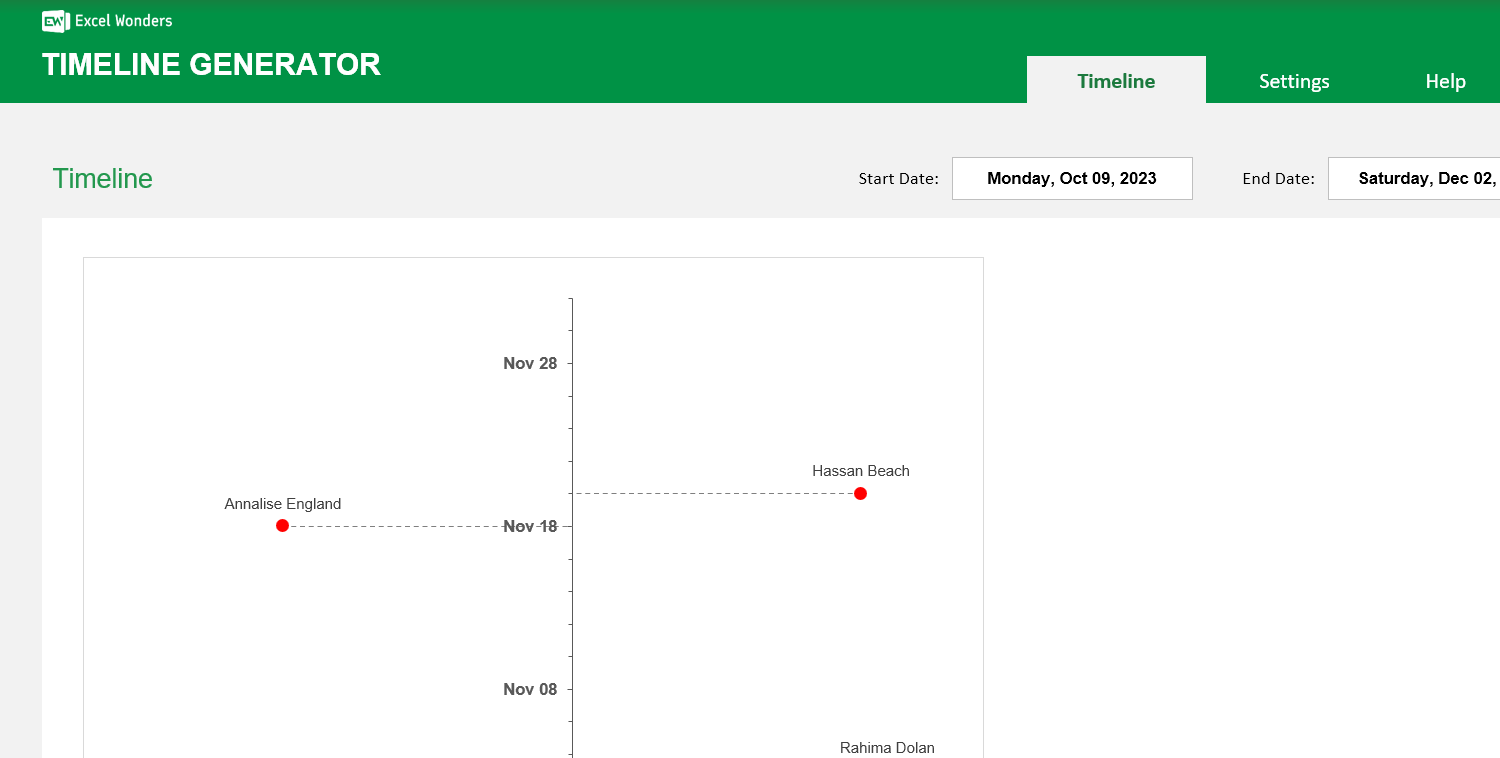
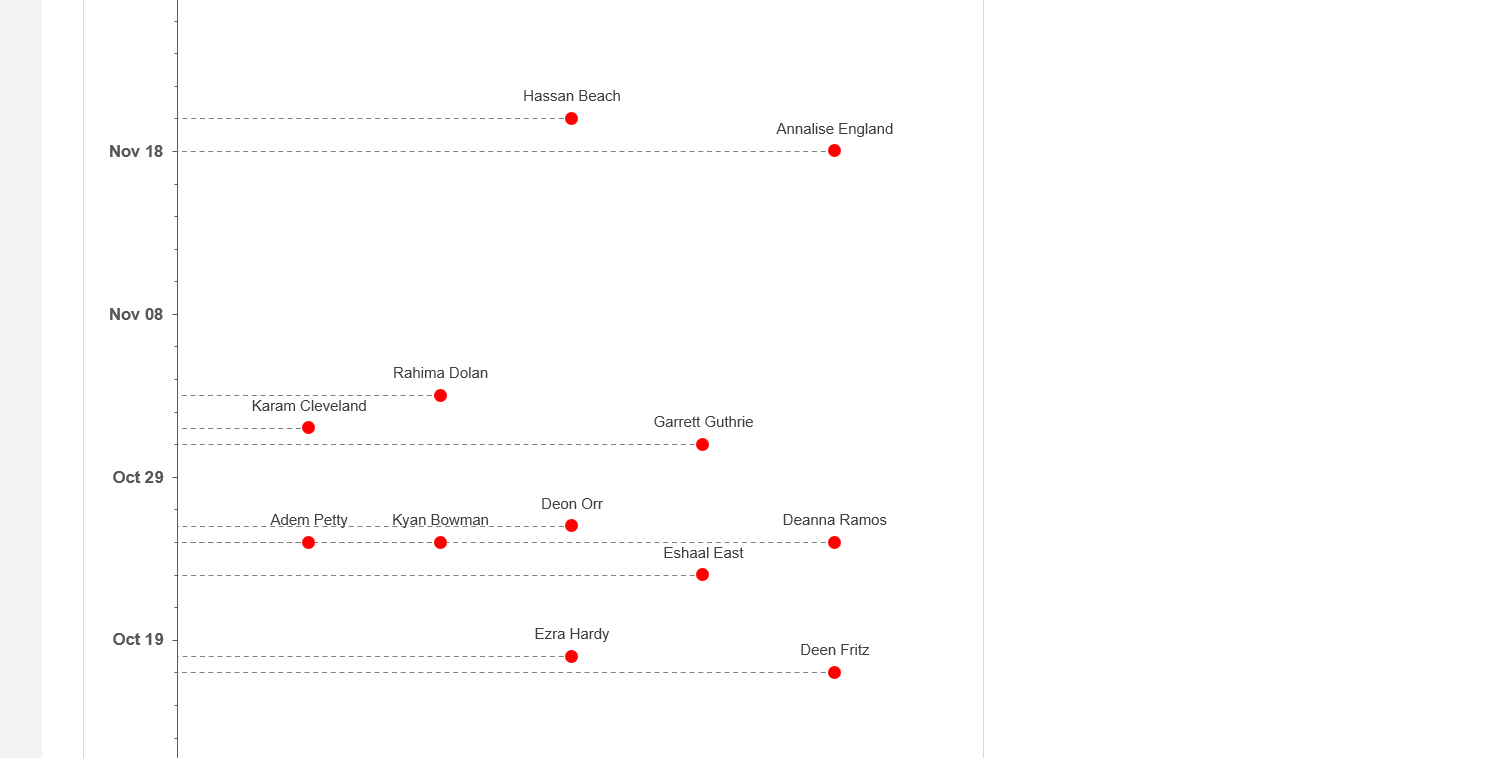
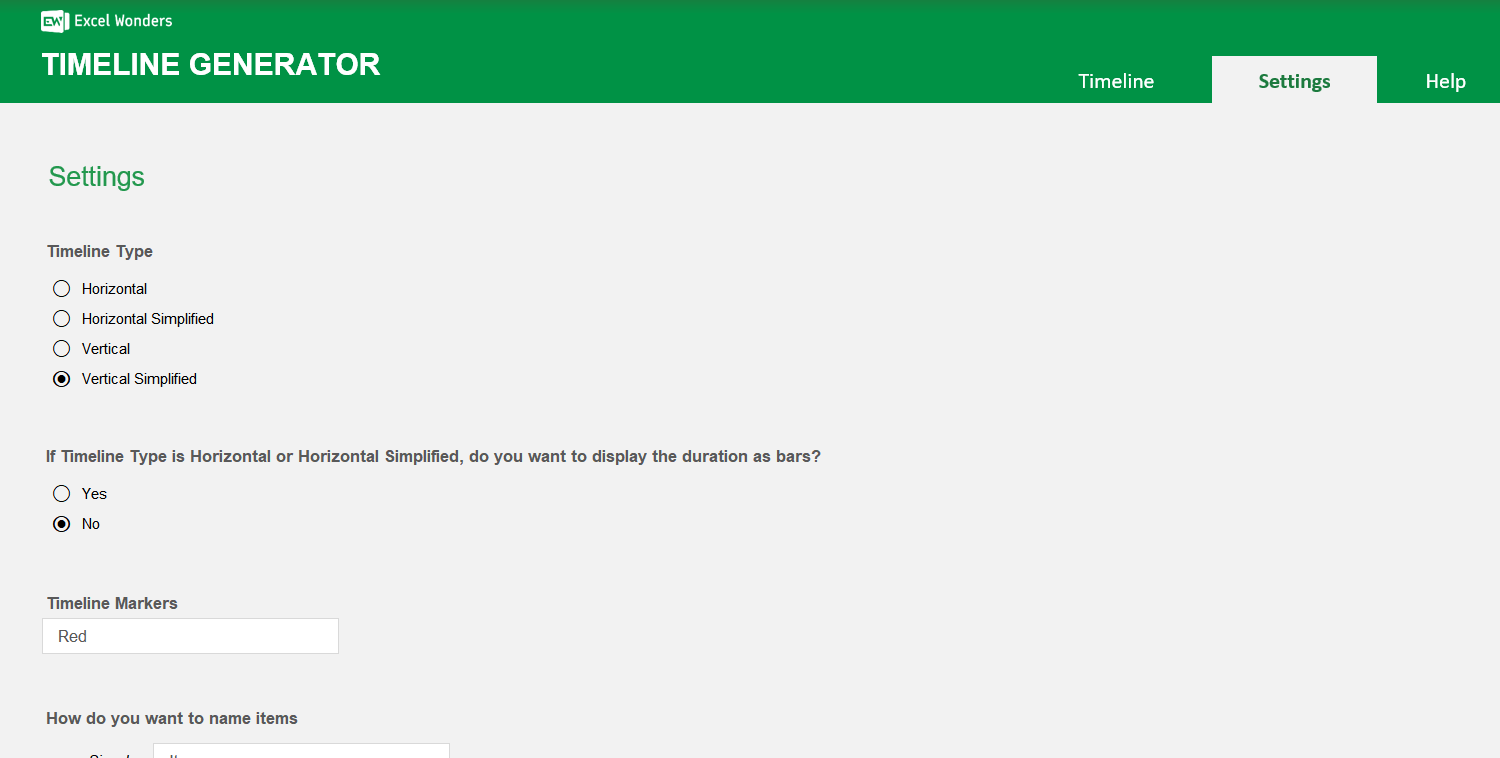
You can choose from four different layouts in the 'Settings' sheet: • Horizontal: Events are staggered on both sides of a horizontal axis. • Horizontal Simplified: All events appear on one side of a horizontal axis. • Vertical: Events are staggered on both sides of a vertical axis. • Vertical Simplified: All events appear on one side of a vertical axis.
All events are managed in the data table on the 'Timeline' sheet. You can: • Add: Click the 'New Item' button. • Edit: Enter your event details and select dates directly in the cells. • Delete: Select an event and click the delete button. • Sort: Use the sorting feature to organize your events.
Yes. Go to the 'Settings' sheet and disable the option for duration bars. The timeline will then display only the event markers without the bars connecting the start and end dates.
Use the 'Starting Date' and 'Ending Date' fields located above the timeline chart. Click on either field to open a date picker, select your desired date, and the timeline will automatically refresh.
Yes. You can select a new color for the timeline markers from the color palette available on the 'Settings' sheet.
Yes. On the 'Timeline' sheet, click the 'Export' button in the top-right corner. A dialog box will appear where you can set the file name and save location for your exported timeline.